
Hello there!
“The Trend is Your Friend”
A famous saying, but how do we actually define it?
Simple! A Trend is PD Arrays holding towards one side of the market.
Let’s break it down, because that statement tells us a whole lot more than what you might initially think.
By defining it we can also understand if the trend is reversing or if we’re looking at manipulation, what our entry can be, our risk management, etc.
Let’s break it down into 3 steps.
1 – The PD Arrays
As mentioned, PD Arrays holding towards one side of the market create a trend.
If Discount Arrays are holding, we have a Bullish trend. If Premium Arrays are holding we have a Bearish trend.
Let’s make sure we’re on the same page. These are the PD Arrays I’m talking about: FVAs, Swing Points, FVGs.
2 – PD Arrays “Holding”
Holding means PD Arrays are getting respected.
We respect PD Arrays when we create new FVGs from these PD Arrays.
Meaning, if we retrace back into a Bullish FVG then we respect that Bullish FVG if we create a new FVG out of it.
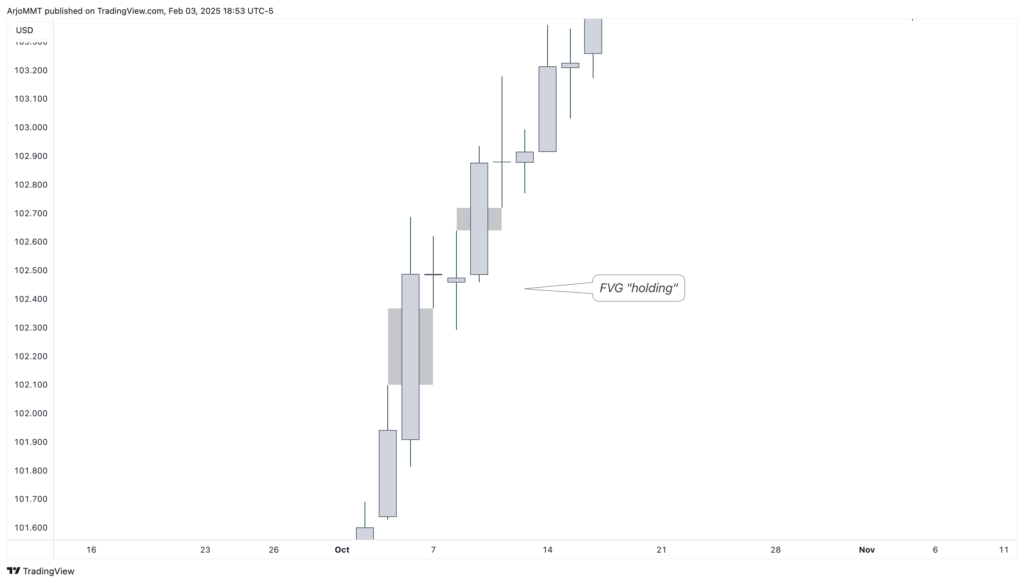
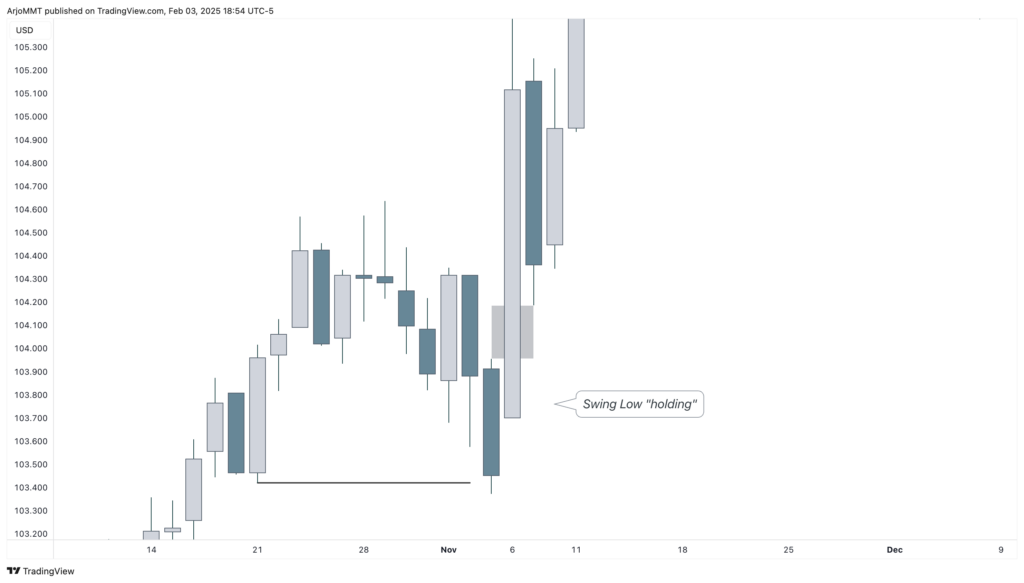
When this happens, it creates a trend. PD Arrays are holding towards one side of the market.
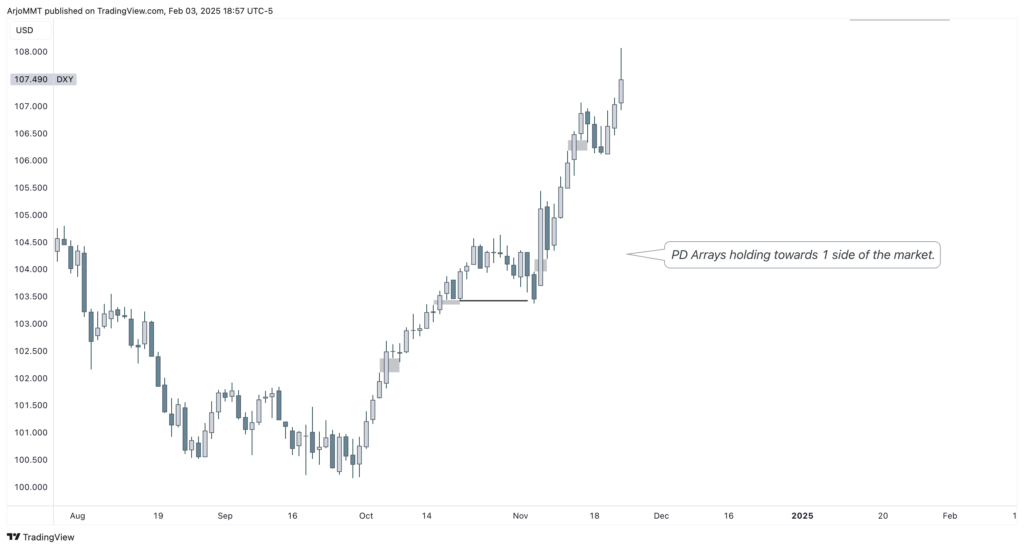
But how do we know if the trend ends?
3 – Reversal
FVGs tell you a direction in the market, yes. But like we see in a Sharp Turn, Fair Value Gaps can also be a great tool for manipulation, to then show us the real move.
So just having one FVG in the opposite direction is not enough for us to understand if the trend is changing.
The answer is in the definition of a trend: “PD Arrays holding towards one side of the market.”
Let’s take a Bullish trend for example. We turn from Bullish to Bearish when:
- We disrespect Discount Arrays, they’re not holding anymore
- We respect Premium Arrays, they’re now holding
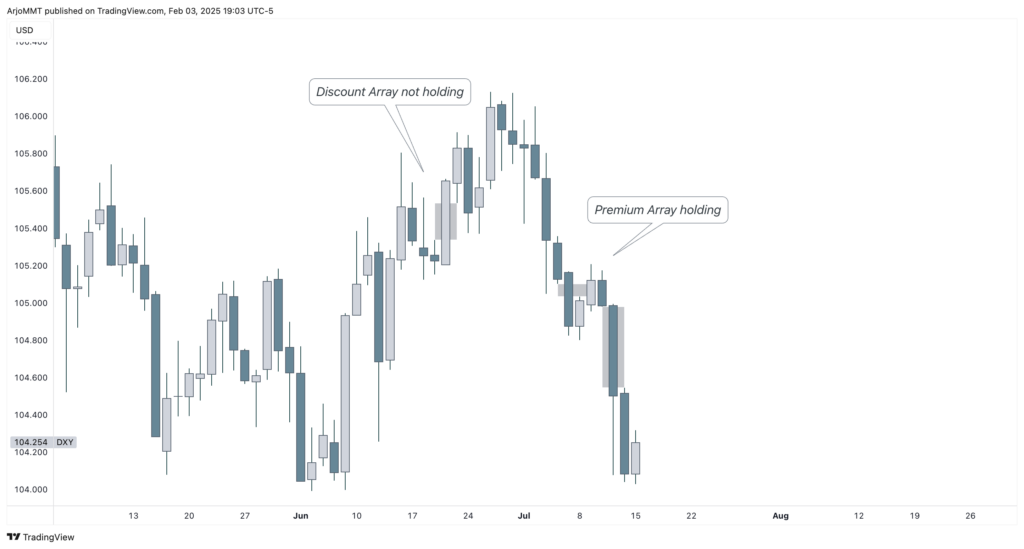
When you align this with the Higher Timeframes first, you now have what we call in the MMT; Order Flow.
See how simple things become when they are defined? We do this with all concepts in the MMT.
If you can’t explain it simply, you probably don’t understand it deeply.