
When you think of trends, you might think of either bullish or bearish.
When MMT students think of trends, they think of 5 different trends that are all within a spectrum.
Understanding different trends allows you to understand when consolidations are likely to happen, so as to avoid a losing trade.
And it allows you to understand when price action does clear up again to take the winning trades.
The 5-Trend Spectrum
It’s a spectrum based on momentum.
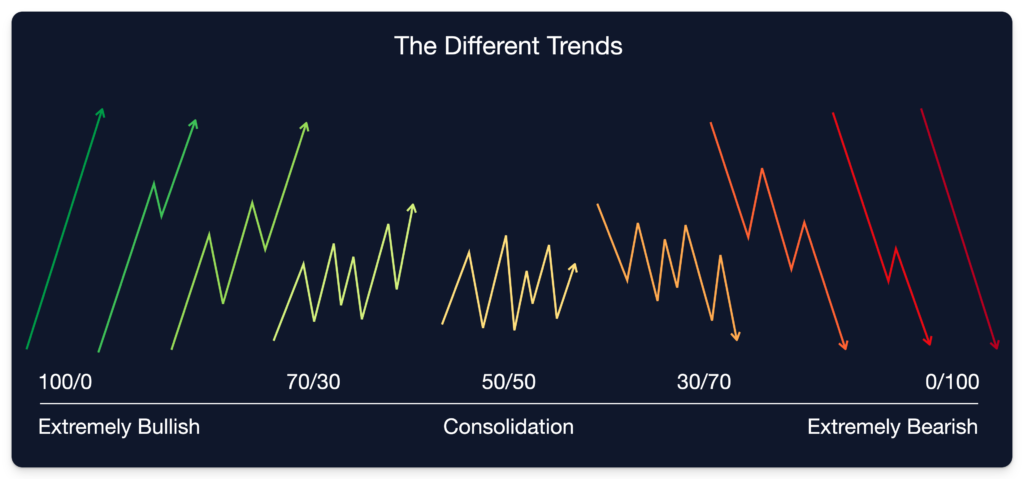
On the outsides we have the breakaway gap trends, the most bullish and most bearish trends.
Next to that, we have the FVG trend, then the FVA trend, then the consolidating trend, and after that, the middle, which is the consolidation.
With each trend that is closer to the consolidation, you’ll see one thing: the retracements get deeper.
If the retracements get deeper, it means we’re getting closer to a consolidation, because the momentum towards 1 side is weaker.
Let me explain that more clearly:
Momentum Explained
As mentioned, the spectrum is based on momentum.
In order for the market to move higher or lower, 1 side needs to be stronger than the other.
If the bullish trend is extremely strong, you’ll see a breakaway gap trend (the 100/0 trend on the left), where we are just exploding higher.
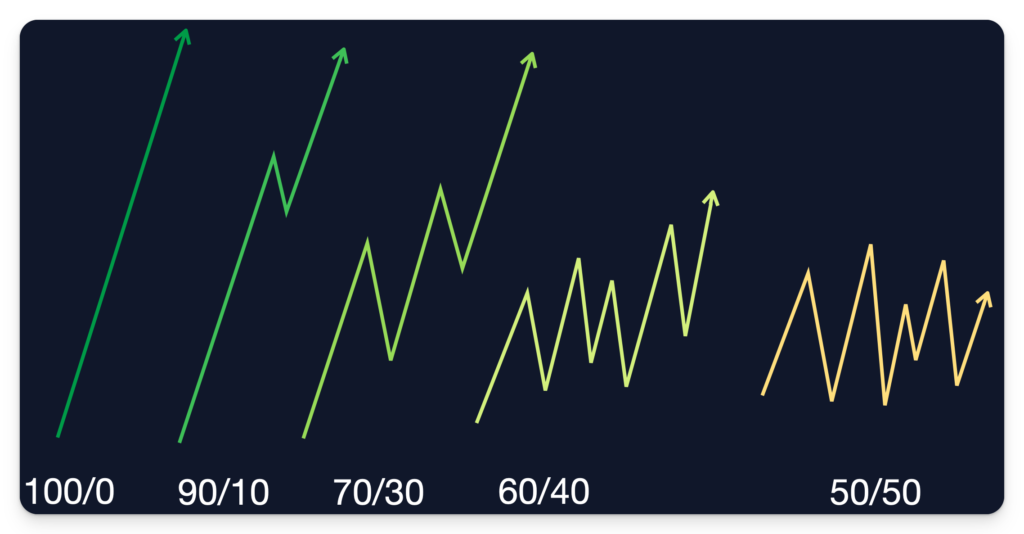
In a bullish trend, if we start to create retracements, then we’re not extremely bullish anymore. Which isnt necessarily a problem, because that might just mean we retrace back into a bullish FVG to then continue higher.
But the deeper the retracements in a bullish trend, the stronger the bearish side is.
If the bearish side is eventually just as strong as the bullish side, then we’re consolidating, because neither side is stronger than the other.
If you want to avoid “bad” price action, you should understand momentum and how that leads to different trends.
Let’s practice with this example.
Practice Example
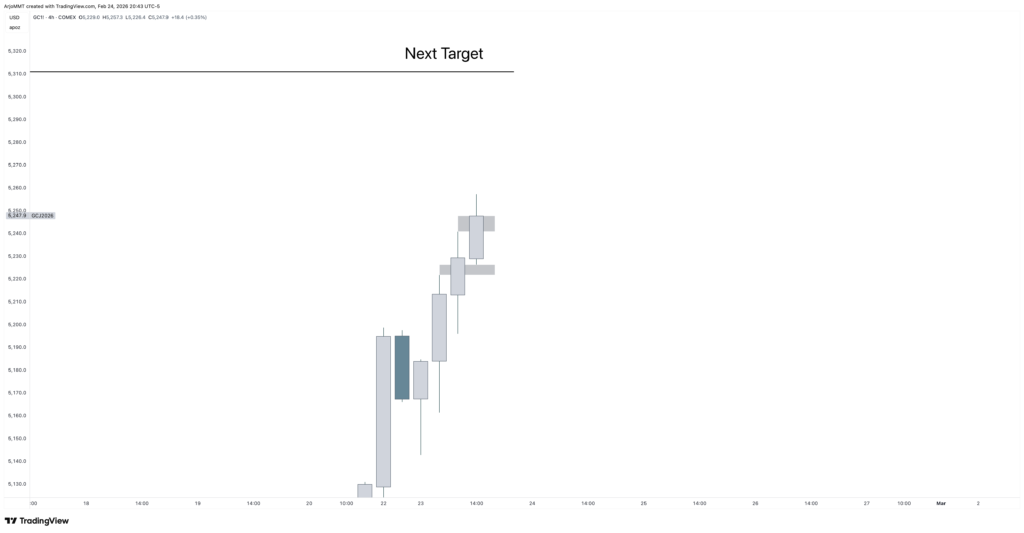
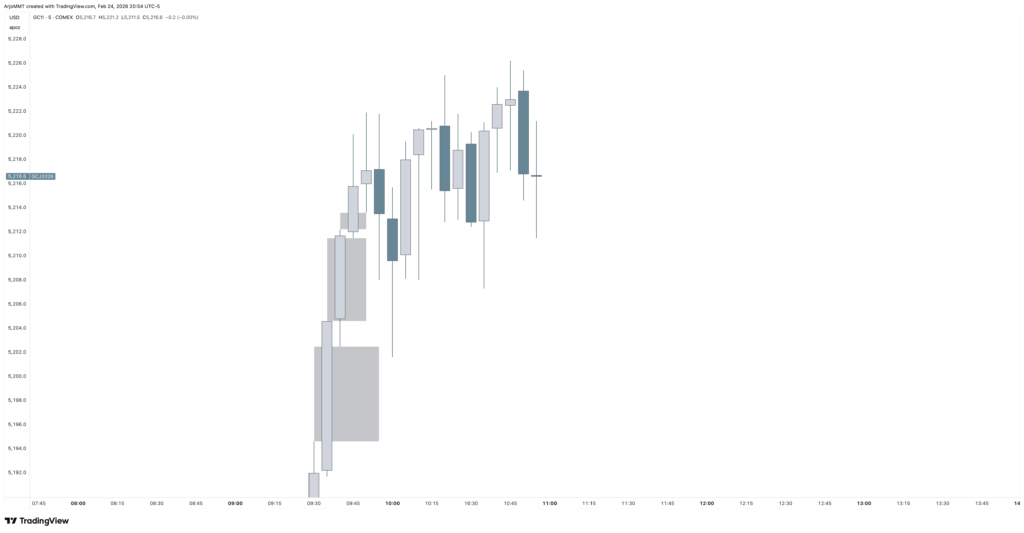
We don’t know any other timeframes, but from the chart, we see we could argue this price action looks solid, right?
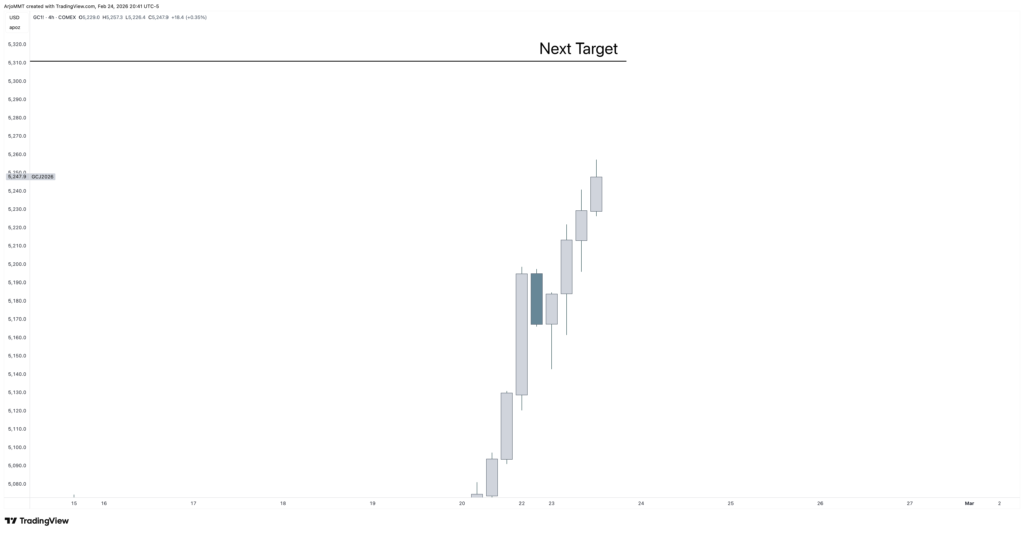
Would you say the same about this price action? And why?
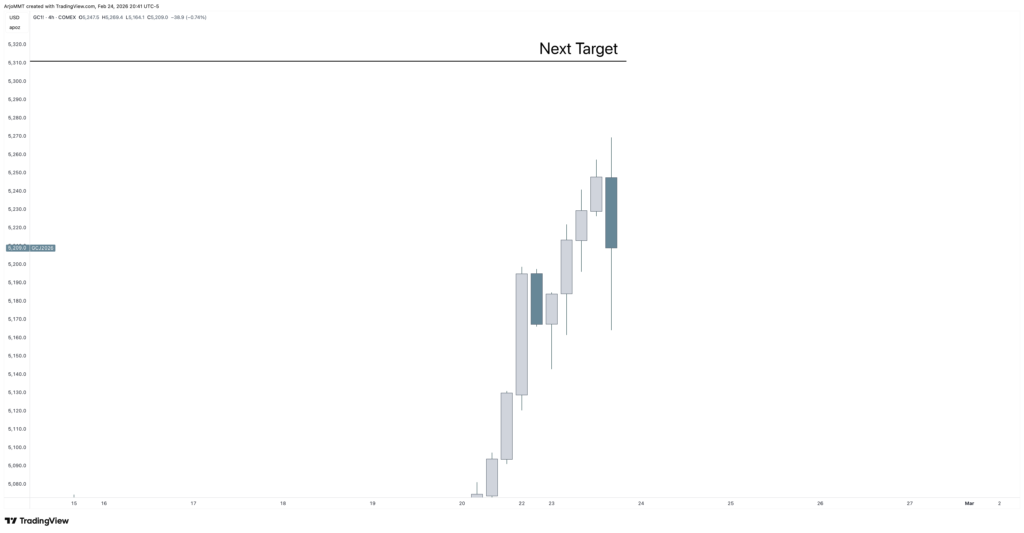
Just with 1 singular candle, the price action completely changed. Why?
Because if we were truly that bullish, we wouldn’t have even needed to create a retracement.
But if we were a little bit less bullish, but still very bullish, wouldn’t you agree that we should create an FVG here? Or at worst, retraced back into the FVG just below?
Instead, we created a very large downcandle, with lots of bearish momentum.
This is something we in the MMT call: disturbance in momentum.
Even worse, we now also create a bearish FVG.
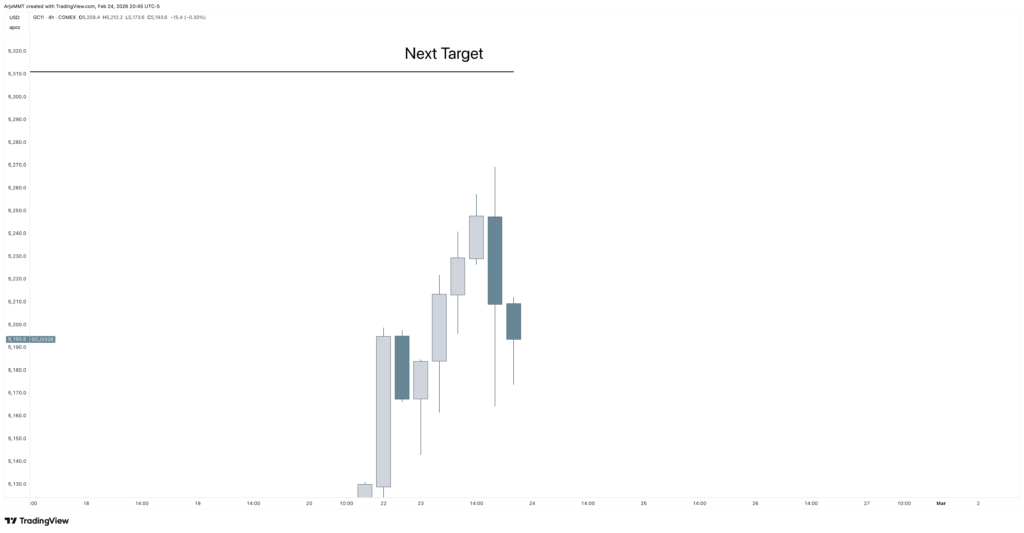
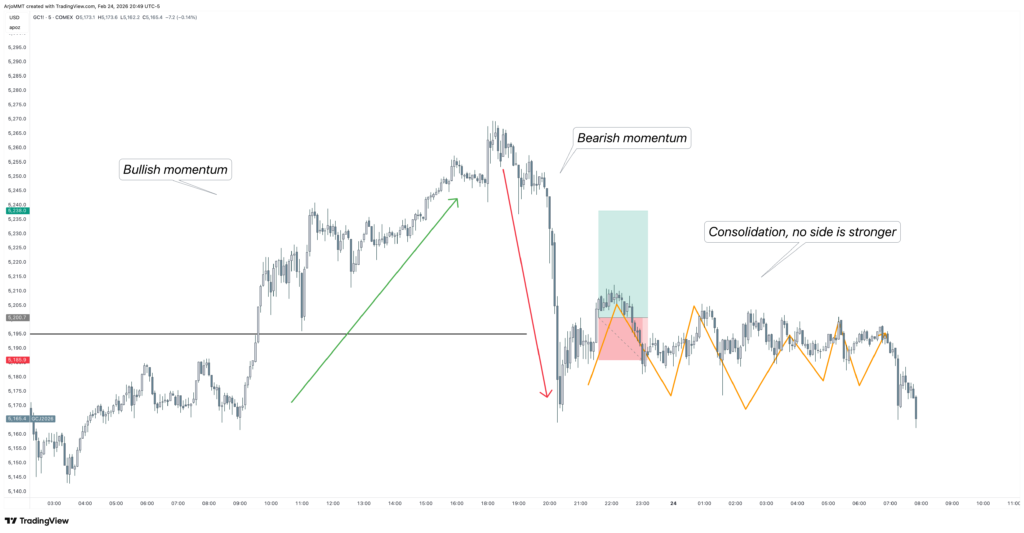
This is where we were in a bullish trend, all of a sudden, the bearish momentum gets stronger than what we would’ve liked. This is the moment we take a step back, we’re not interested anymore.
Yet this is the moment many traders look for their entry.
How many traders are taking entries whilst we’re retracing back into an FVG, or Order Block? Can you see the problem now? You’re completely going against the momentum, and on top of that, the momentum is telling you that we’re likely to consolidate next.
More Details That Most Miss
The devil is in the details!
Always ask yourself: “If we were truly that bullish (or bearish) what should’ve happened?”
Look at this scenario, anything wrong with it?
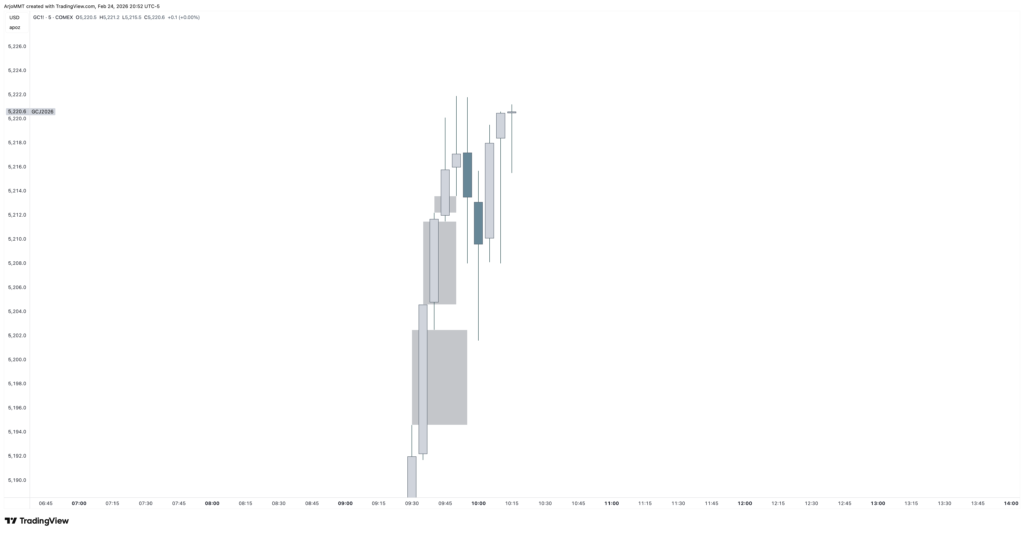
How about the fact that we retrace back into the 3rd FVG instead of the 1st FVG?
How about the fact that it takes multiple candles to create a rejection?
Those are all signs that the bullish side is simply getting weaker and weaker, so what can we expect next?
Sooner or later, a consolidation will occur because the momentum is disturbed.
How Can Price Action Be Good Again?
Apply the opposite of what we discussed.
If we see a consolidation, the way to get out of that is when 1 side is stronger again. For example:
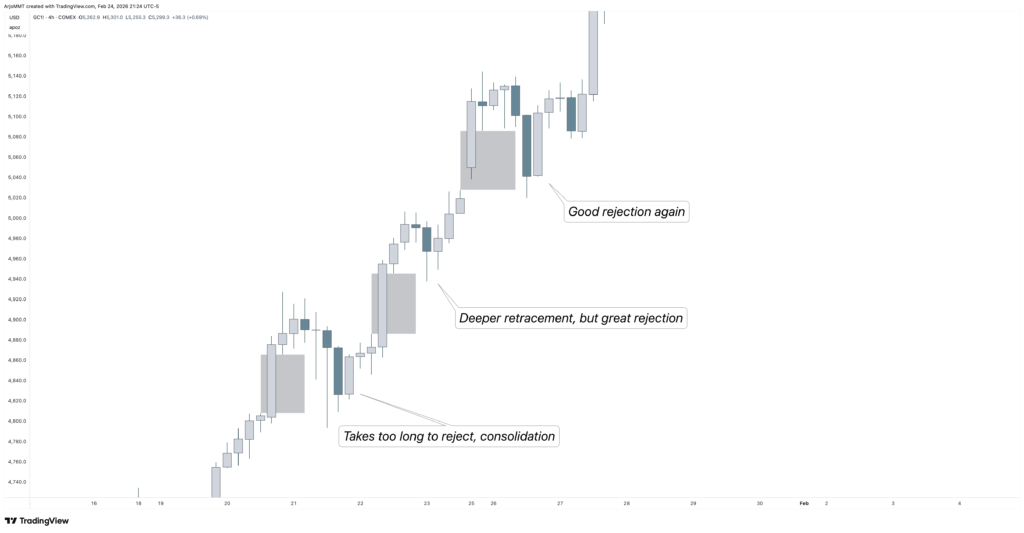
At the bottom, we see a short consolidation because it takes too long to reject, disturbing the momentum.
Once we explode higher again, and we do create retracements, the retracements get followed by great rejections from FVGs. Now we can say that the bullish side has recovered and is stronger again.
You climb from the middle of the spectrum to the outside.
Sub-optimal Price Action
There’s optimal price action and sub-optimal price action.
The difference lies between what you demand and reality.
I demand optimal price action: “What should happen if we’re truly very bullish?”
And what is the reality? If the reality is any different from my demand, I don’t want to engage with price action.
If I want to go and ski, I demand snow.
If Mother Nature doesn’t give me snow, then why would I still go skiing? I would be engaging in sub-optimal conditions.
This is what trading is all about, knowing the conditions you want to enter on and which ones you won’t.
Once you have a very good understanding of momentum and what makes certain conditions high or low probability, it’s like controlling your trading plan, like adjusting the volume button.
You can easily see and say, “okay I’m going to up my trade frequency by engaging with mid to high-level probability areas.”
If that doesn’t work out next week, you’ll say, “okay I will now only engage with high probability areas.”
With the click of a button, that’s the amount of control you should have as a retail trader.
These lessons are a tip of the iceberg as to what we discuss in the MMT. If you’re interested in the full rabbit hole, the MMT will help you further.
Have a great day!
Arjo Janssens – MMT