
I want to introduce you to part of the strategy I use for investing/trading in stocks.
There’s a new Stocks Module in the MMT right now discussing this and more.
Let’s start from the beginning:
Why stocks? Why even bother?
I got introduced to trading through stocks. I’ve always had a soft spot for stocks; I really enjoy studying and investing in them.
On top of that, I started realizing that my trading plan currently aligns very well with All-Time Instruments, think of ES, NQ, Gold. But then also stocks.
Actively investing in stocks plays to the strengths of my trading plan.
Currently without margin, just buying spot shares, no leverage, no options.
I’ve caught the move on RBLX to the All-Time High, SHOP, and AAPL. All using the same principles we’re going to discuss here.
Stocks vs Companies
There’s a difference between the stock price and the actual company.
Of course, when you buy a share, you’re buying a small part of a company. That’s the stock.
That single share has a certain price, the stock price.
But I used to think that the stock price is a direct reflection to how the underlying company is doing.
So, a high stock price: the company must be doing great. A low stock price: the company must be doing badly.
That thinking is flawed.
The first thing you absolutely need to understand is that the stock price is not a direct reflection of how the company is actually doing.
Why?
Supply and Demand
There’s only a limited number of shares for every company. So, for example, for the stock AAPL, there might be 15 million shares that are all in possession of different people.
People pay for a share what they’re willing to pay for it, and what people are willing to sell it for.
So at its core, it’s supply and demand.
That also means that, in theory, you and I could buy all the AAPL shares in the world and only sell them for an insane amount, driving the demand up and up.
In reality, this works in a very similar way.
How does demand increase?
Well, imagine that the whole world starts talking about how amazing this AAPL stock is, traditional media, social media, it’s everywhere.
The demand gets inflated, artificially.
But an increase in demand doesn’t mean that the company is actually worth all that demand.
Think about it, we could increase the demand for a limited edition shoe. A $100 shoe could get inflated to $1000. But people will soon realize, “Well, it’s just a shoe, is it really worth that?”
With stocks, of course, it’s not just a shoe.
But there are many stocks out there where the company doesn’t actually make money, and besides that, the stock is still skyrocketing. How does that make sense?
Overvalued vs Undervalued
Once you understand that supply and demand, and human nature, for the most part, drive stock prices, you can start seeing the opportunity gaps.
Example:
ArjoStock, the company, is generating $1 million in revenue, with a stock price of $10 per share.
Now, 3 quarters later, ArjoStock is doing $1.2 million in revenue, with a stock price of $50 a share.
So the stock price increased 5x, but the revenue only increased 0.2x.
How does that make sense? It doesn’t! That’s the point.
This is something you’ll see very often in stocks. In the example above, you could argue that we’re overvalued.
The stock price and the company price are 2 different things. Imagine it like an indicator, an extra line on your chart. Our goal is to accurately estimate where the “company price” is.
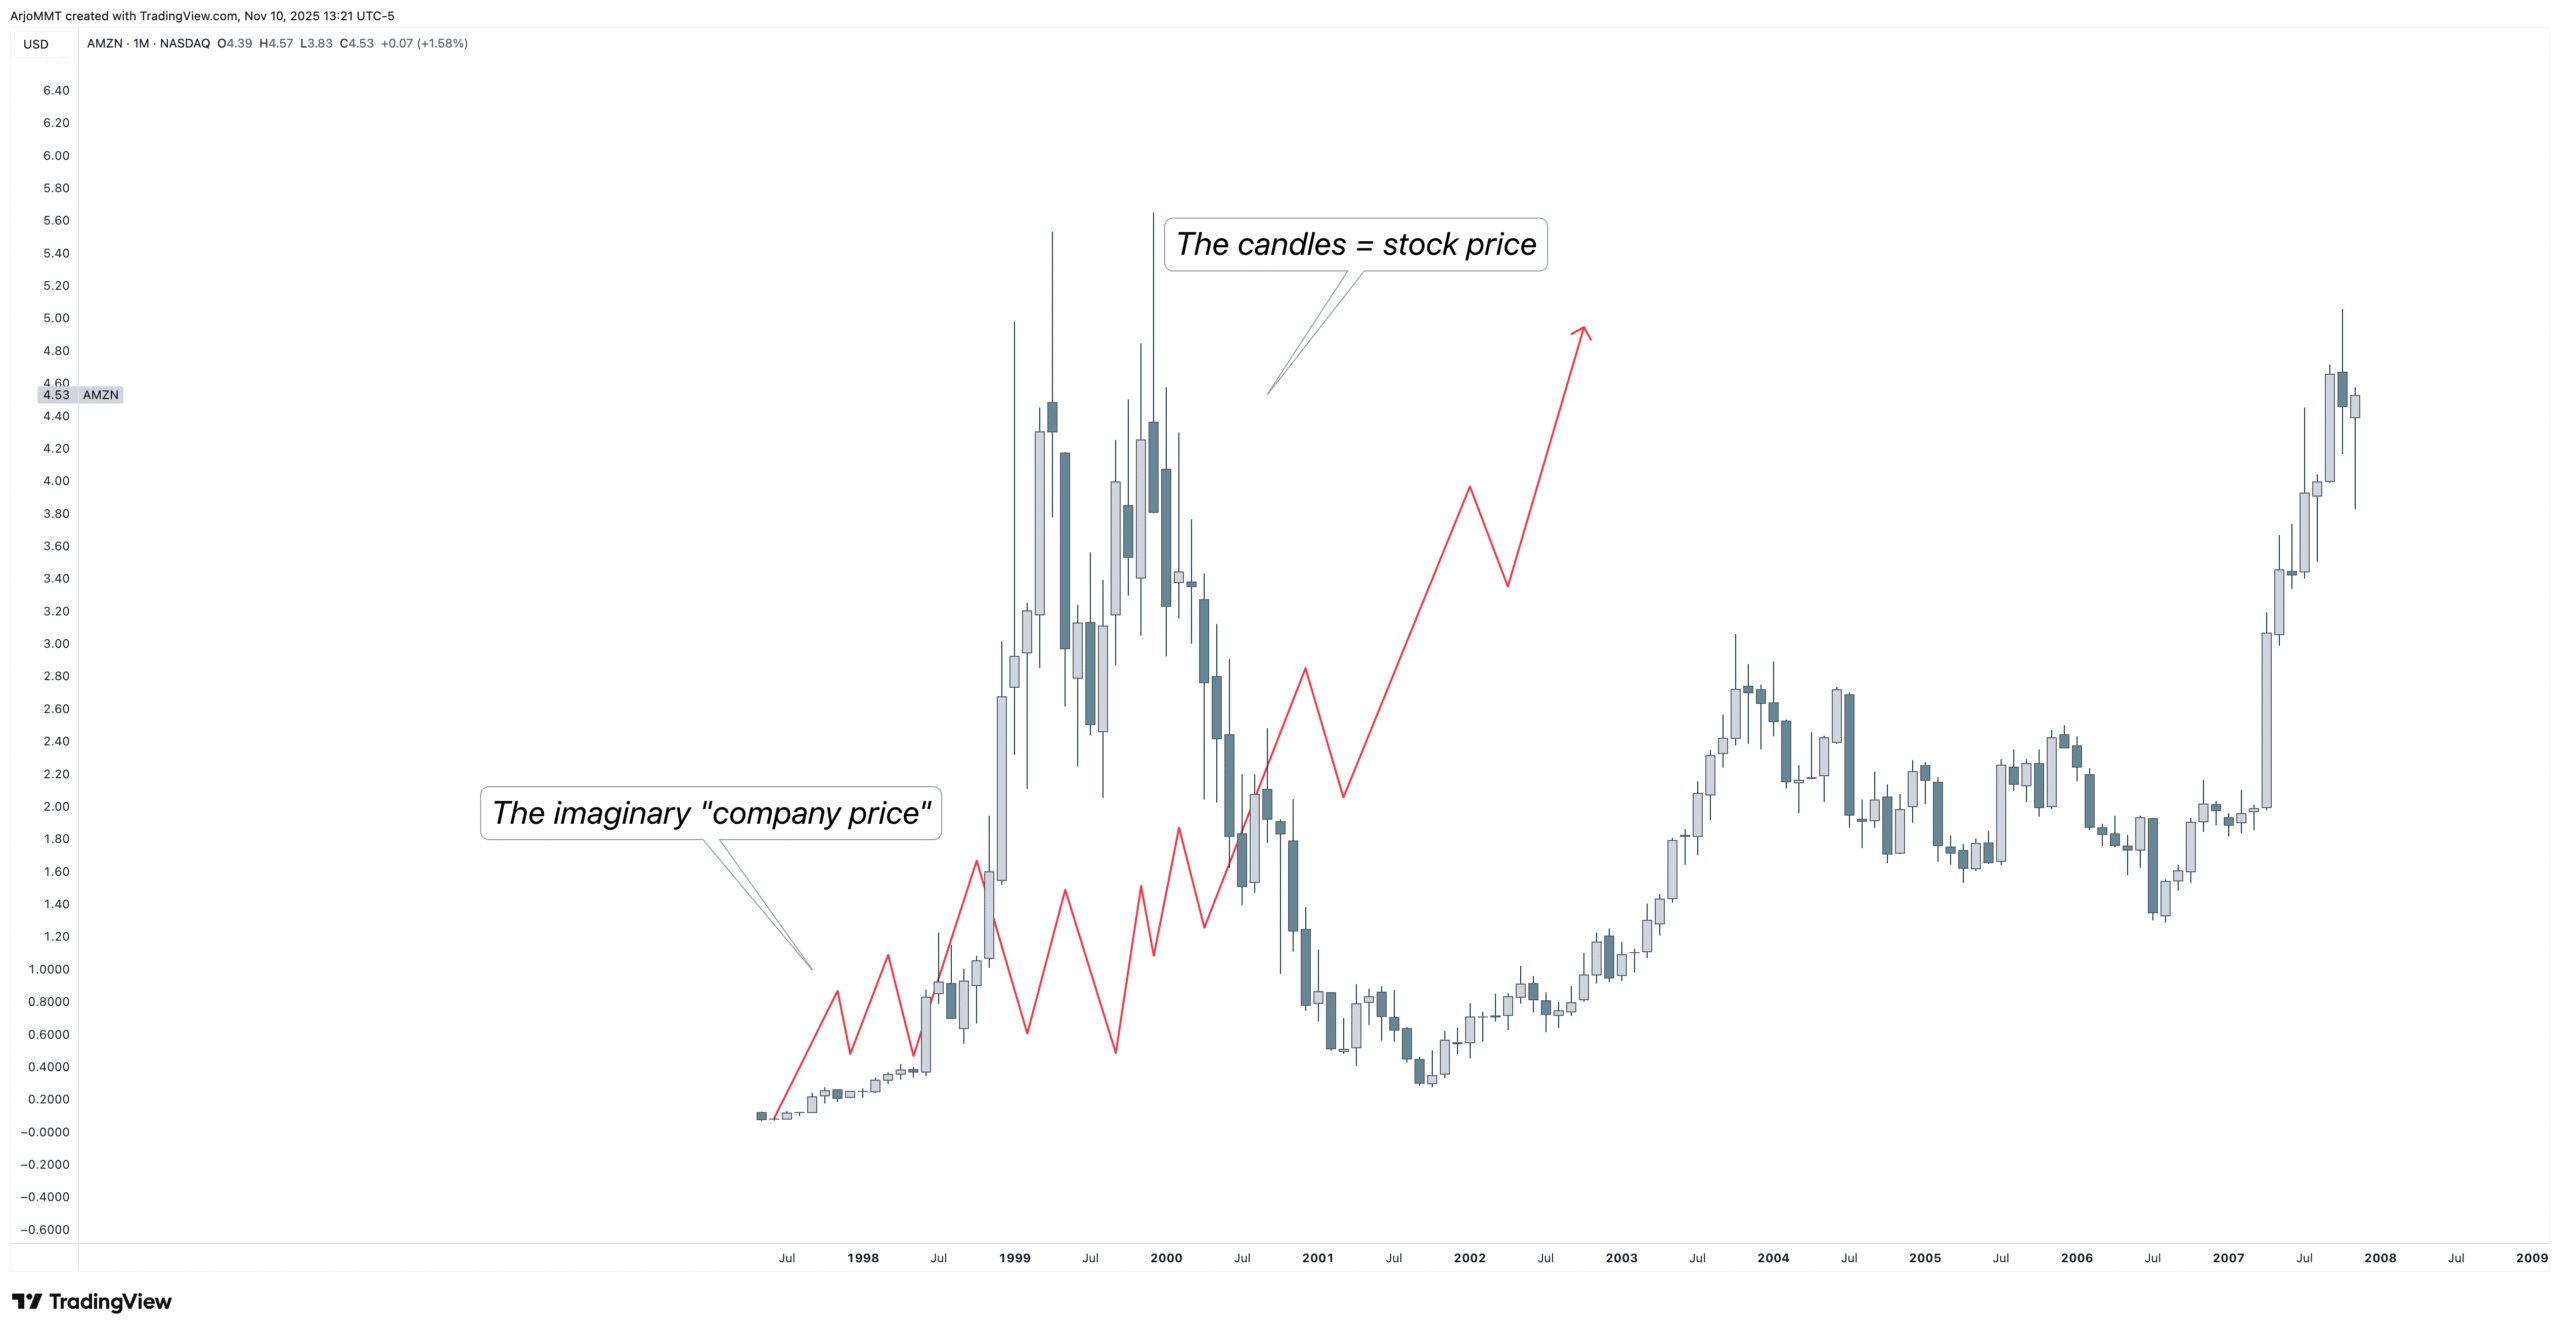
The imaginary company price is how the company is actually doing, the revenue, the profitability, the growth.
The stock price could be overvalued or undervalued, not an accurate representation of what the company is actually doing at that moment.
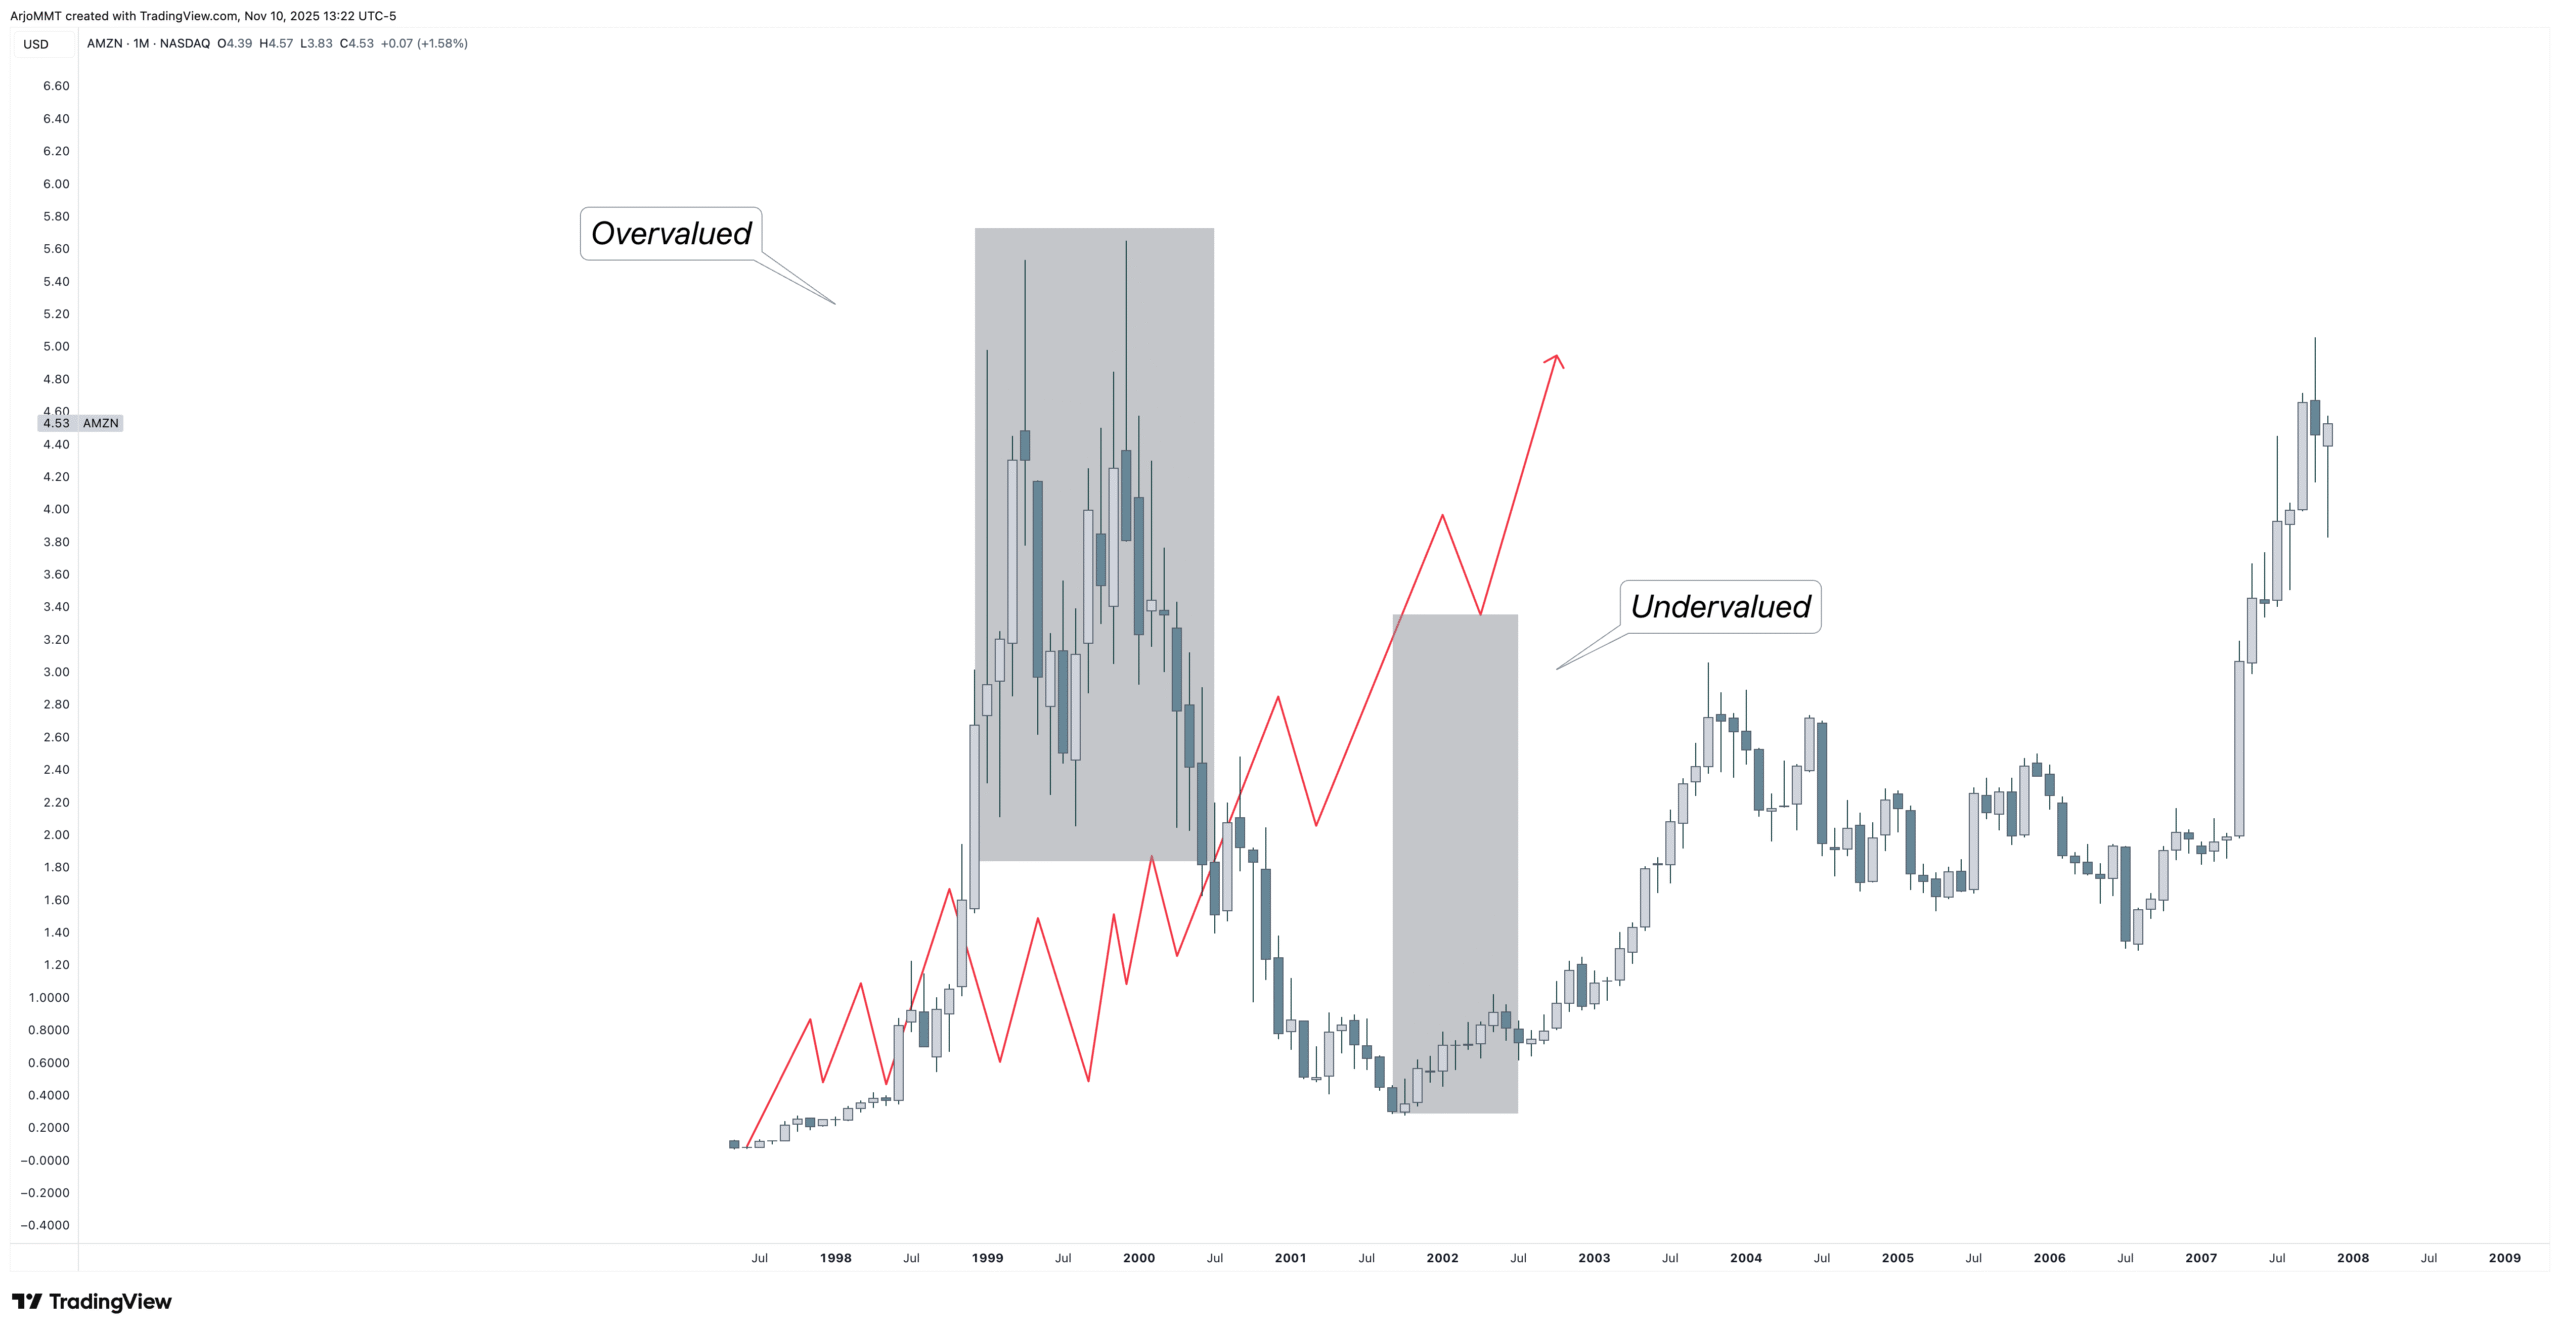
When the stock price is above where we think the company price should be, we’re overvalued.
When the stock price is below where we think the company price should be, we’re undervalued.
Those grey boxes are gaps. You could argue that they’re Fair Value Gaps! Because it’s not Fair Value! (haha nice)
For simplicity’s sake, we call them Opportunity Gaps.
How can we accurately know where the company price “should” be?
Fundamental Analysis
By definition, how do we know if something is overvalued or undervalued?
We can only make an accurate guess by comparing.
Comparing the metrics of the company to previous stock price points.
For example:
ArjoStock is doing $1.2 million in revenue at $50 a share.
A year later, ArjoStock is now doing $2.4 million in revenue at $5 a share.
That would mean that the revenue has doubled, yet the share price is ten times as low.
That doesn’t make any sense. Correct, it doesn’t. Because it’s undervalued.
Of course, a very simplistic example, so here’s a better one that we used in the Stocks Module.
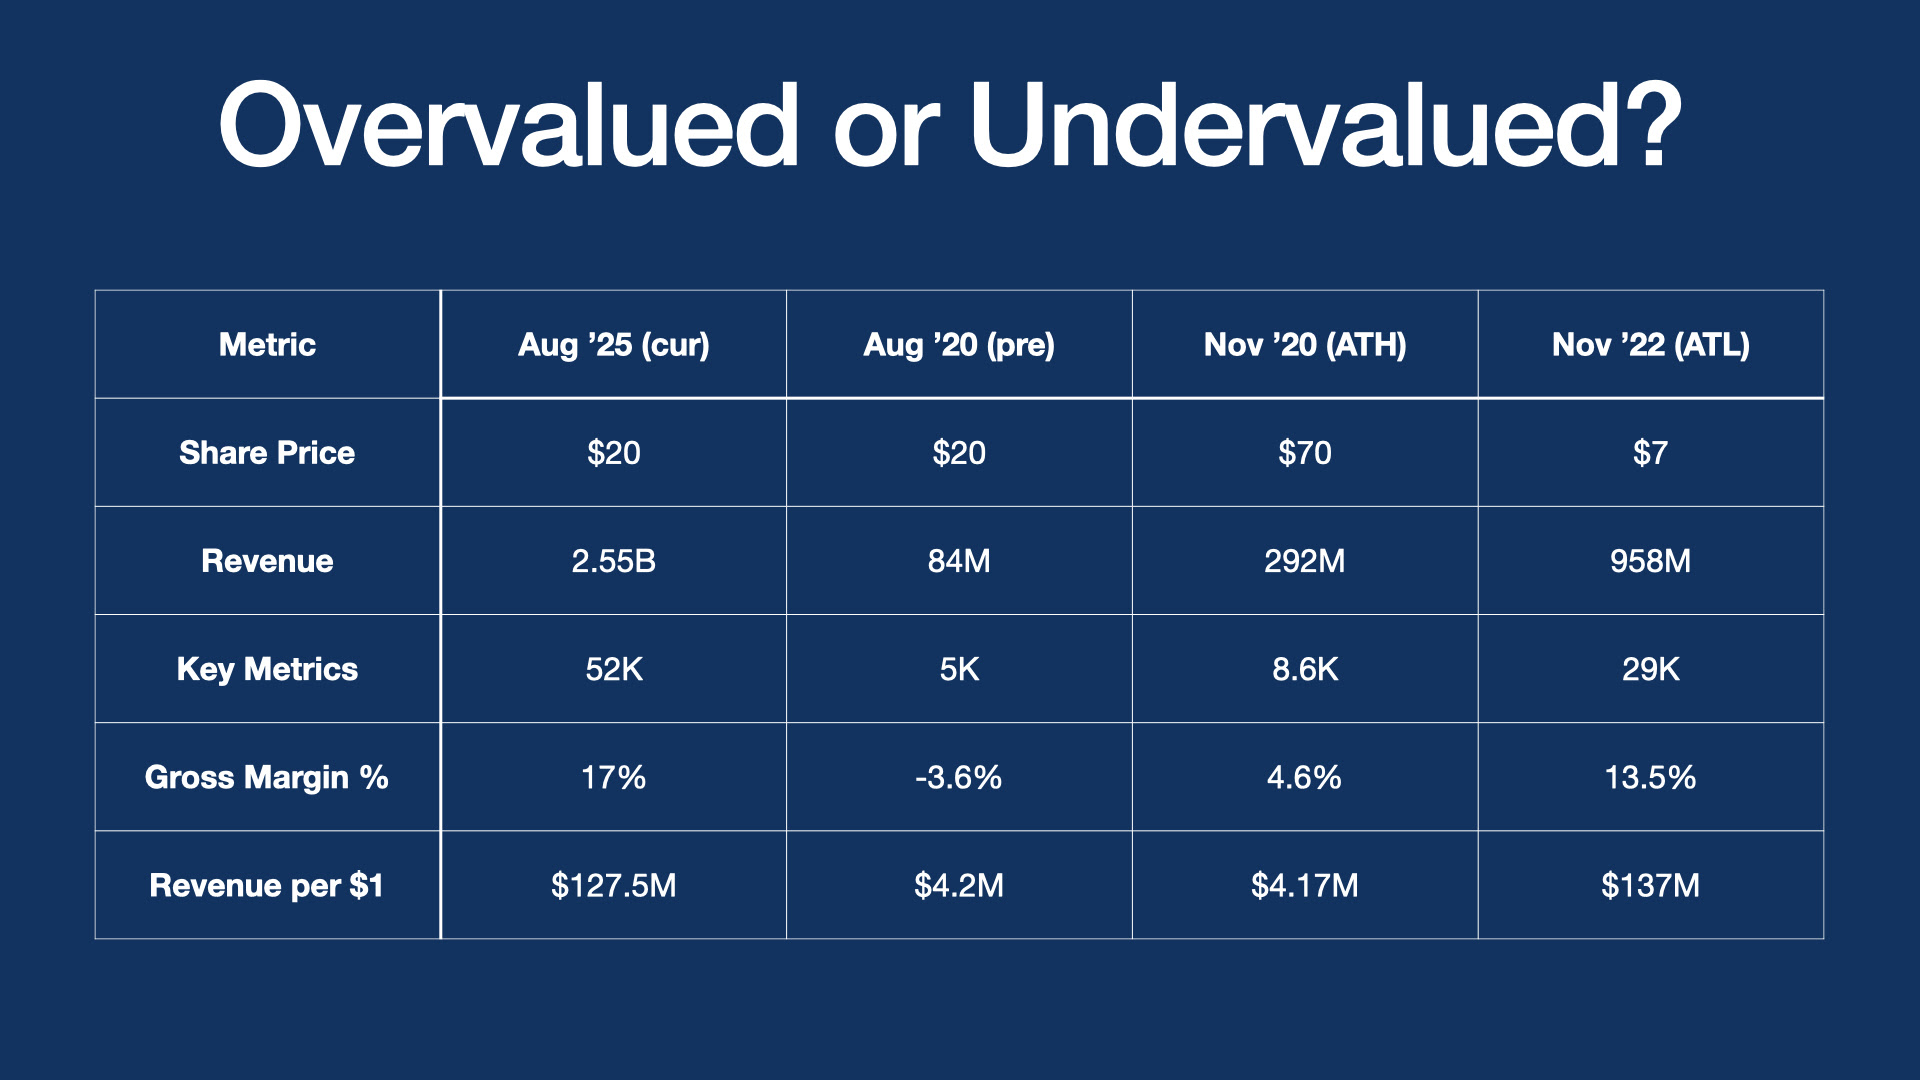
The above stock is XPEV.
We’re comparing four price points:
- The current (where we’re trying to figure out if it’s overvalued or undervalued)
- The previous time it was at the same price per share.
- Previous All-Time High
- Recent All-Time Low
From these metrics, you could argue this is quite undervalued.
So do we buy?
Technical Analysis
What is the most objective way to know if a stock is being bought and demand is increasing
Candlesticks.
Bullish candles mean more people are looking to buy, and the demand is increasing. That’s the most objective way.
Undervalued stocks can stay undervalued forever because the demand might never increase.
So, combine Fundamental Analysis here with Technical Analysis.
In the Technical Analysis, we want to see Order Flow being built. That’s a sign of demand increasing, objectively.
FA + TA in the case of stocks makes a killer combo.
If this interests you, there’s more of this in the Stocks Module for you.
Have a great day!
Arjo Janssens – MMT