
Candlestick Patterns For Beginners: A Simple Starter Guide
October 28, 2025
In the day trading for beginners guide, we show how day traders profit from short-term price movement. To profit from the market’s volatility, they need indications or signals as to where the price is heading. This guide on candlestick patterns shows how traders can see market structure or trends forming, allowing you to do the same and make profitable trades.
Disclaimer: This is for education only, not financial advice. Trading involves risks where you can lose money!
Key Takeaways:
- Candlesticks visualize market sentiment for a period.
- Common patterns convey reversal or continuation.
- Read patterns within the market structure and key levels to determine whether the trend continues or shifts.
What Are Candlestick Patterns?
Candlesticks are how you can perceive the market sentiment during a specific period. Apart from telling you the value of an asset, it also tells you at which price levels most traders are willing to set their positions.
The candlestick patterns were first conceptualized by Menhisa Honma or Sokyu Honma, a rice merchant based in Sakata, Japan. In 1755, he wrote The Fountain of Gold: The Three Monkey Record of Money. This was the very first book in history about market psychology that talks about “traders’ emotions affecting rice price.” There is a rotation of Yin and Yang in the market where traders are bullish or bearish about the market.
Honma’s candlestick patterns made their way to the West during the late 20th century. Traders are now using it to analyze market sentiment on various assets like stocks, commodities, and forex.
Anatomy of the Candlestick
In order to read candlestick patterns, it is important to know what you are looking at.
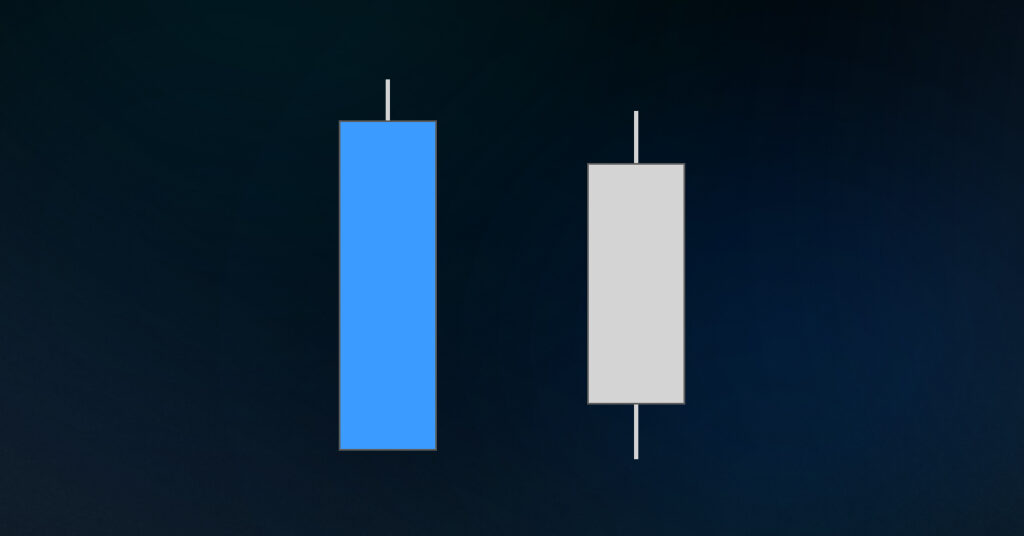
- Candlestick Color: Every candlestick has two colors to represent its direction. In all exchanges, they are green and red. For our charts, we use blue and gray to represent their directions. If prices are rising or becoming bullish, it is colored blue. Bearish candles that show prices are going down are gray. Note that these colors can be changed to suit your preference. What is important to you is where the prices are heading based on the candlestick.
- Candlestick Body: The elongated or rectangular part of the candlestick shows where the price opens and where it closes. Bullish candlesticks open at the bottom and close at the top, while bearish ones open at the top and close at the bottom.
- Candlestick Wick: The lines extending from the top and bottom of a candlestick are where the highest or lowest prices were able to reach. A wick forms when a price rises or falls, then returns to a previous value.
Using The Candlestick
The direction and price points in the market can tell you where traders are placing their orders. It also shows points where there are no orders
You can already read the market sentiment with just one candle within a specific period. A long blue candlestick with no wick at the bottom and a small one at the top indicates a strong bullish market, with prices rising. Suppose a gray candlestick forms with another long body and two small wicks, indicating bearish price action. If there are wicks on both ends that are longer than the body, the market is indecisive.
Understanding trading behavior using candlestick charts is one of the skills successful day traders use. You can learn more ways to interpret the market and identify the right risk strategy for your portfolio by joining our MMT beginner membership. For just 1 EUR, you have lifetime access to profit-oriented resources.
Reading the Candlestick Patterns
While a single candlestick shows you the market sentiment for a period, you need to consider several of them to read the current trend. Candlestick patterns often show if there is a downtrend or an uptrend based on the bullish/bearish movement of each stick. You can also see where most traders place their orders based on the sticks’ movement.
There is a wide range of candlestick pattern interpretations. Below are the most common ones followed by traders:
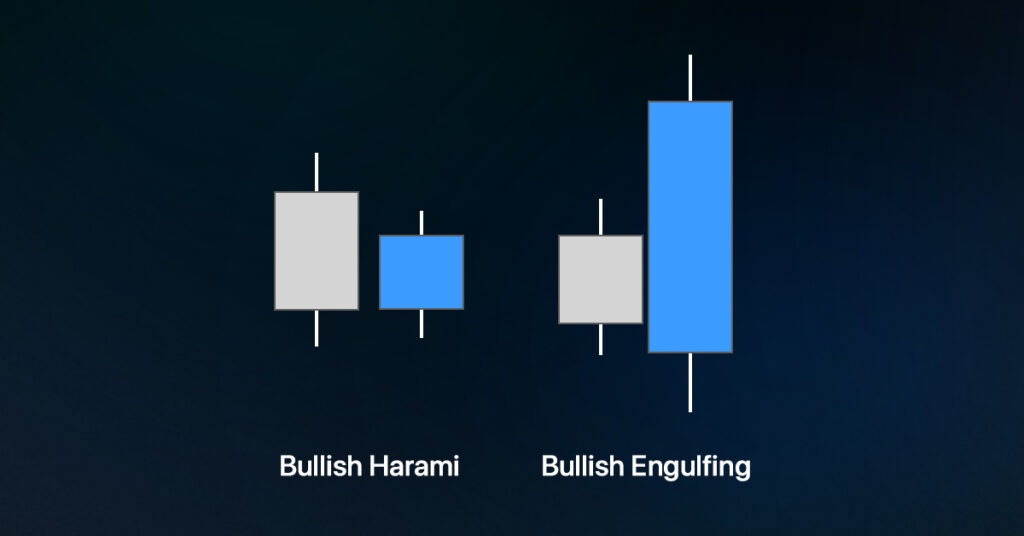
Bullish Harami and Engulfing Pattern
One of the two-set candlestick patterns that is easy to read is the bullish harami. You can spot this with a series of bearish candles followed by a small bullish one. A similar pattern is the bullish engulfing stick, where a larger blue candle appears beside a small grayish one. The harami and engulfing pattern shows a reversal trend of the price drop with buy orders about to enter the market.
Note that there are also bearish Harami and bearish engulfing. Both bearish candlestick patterns show a potential reversal of the bullish trend, where a large set of selling orders will appear.
Morning Star
One of the known three-stick candlestick patterns is the morning star, which shows a bearish trend shifting to a bullish market. Look for a series of bearish candles followed by a thin candlestick and bullish candles. You want the second set or the middle candlestick to be bullish or the opposite of the previous set.
The rationale behind this pattern is that the number of buying orders exceeds the number of selling orders. You can see it with the middle stick, where there are nearly an equal number of buy and sell orders.
An inverted pattern of the morning star is the evening star. This pattern shows a bullish trend turning into a bearish market.
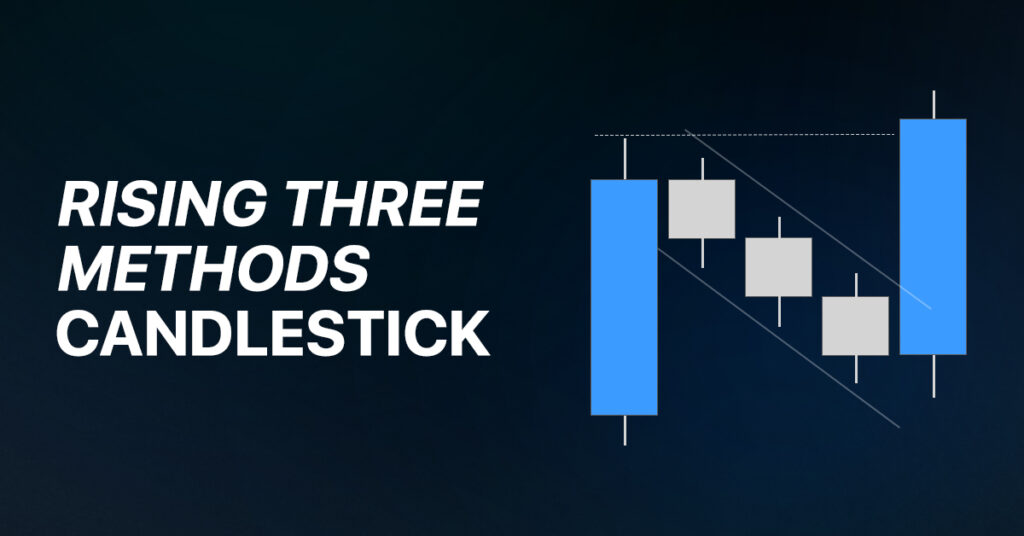
Rising Three Methods
Another form of candlestick patterns to look for in the rising three methods. The first set of candlesticks shows that the price is going up. This is followed by candles going the opposite direction, but have the same height as the first set. The final set shows a candle continuing to move upwards.
The rising three methods are a continuation signal where there is a bullish trend. When prices increase, there are traders taking profit from the market movement. Selling orders are not enough to stop the bullish trend, as shown by the third candlestick set.
The opposite pattern of this candlestick pattern is the falling three methods. This shows a bullish trend occurring that pauses in the middle, with traders possibly exiting from their short position to take their profit in case the market trend goes upwards.
Hammer Candlestick
As the name suggests, a hammer candlestick has a short body and a long wick at the bottom that is longer than the main body (creating a hammer shape). The previous candles from the hammer move in a bearish pattern, while the next set of candles form a bullish movement.
This candlestick pattern indicates a market shift, with the hammer showing a number of selling orders slowly dissipating while buy orders are coming in. While the hammer is a bullish signal, it is a cautionary one due to its formation. The long bottom wick shows there is buying pressure to create a bullish movement, but is not strong enough to create a longer candle body.
Note that an inverted hammer candlestick is another similar pattern that also indicates a bullish shift. These are often formed after a series of bearish candles.
Identifying the Market Structure With the Candlestick Patterns
Day trading is all about knowing if either the bulls or the bears are taking over the market, or if neither is going to give the other ground. To see where the market is heading, you need additional context on the candlestick patterns.
Recognizing the Market Structure
An important skill for a day trader is to see the market structure through the candlestick patterns. One method of identifying the market trend is the series of higher highs and lows or the lower highs and lows:
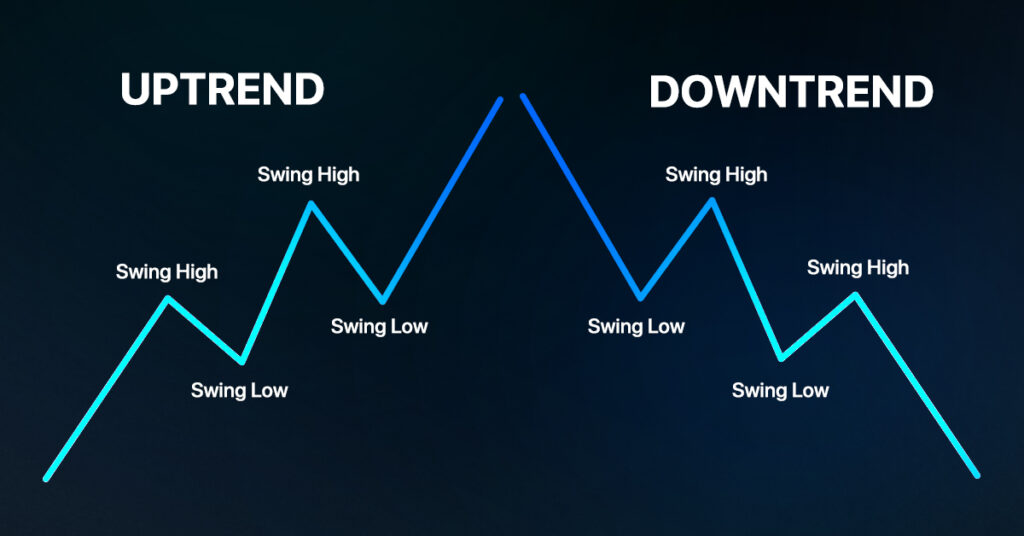
- Higher Highs and Lows: These are the candlesticks made by a bullish market where a series of blue candles are surpassing its previous bullish ones. There are also bearish candles that are surpassing their previous lowest levels.
- Lower Highs and Lows: During a bearish market, there are bearish candles dropping further beyond its previous lows. Blue candles are also dropping below previous bullish candles.
If you spot an uptrend or downtrend in the market, look for candlestick patterns in the recent chart. Continuation signals like the rising three method during an uptrend market are a good sign to enter a long position.
Using Candlesticks to Find Support and Resistance Levels
There are two significant types of patterns from the previous section: continuing and shifting. The bullish Harami and the rising three methods are examples of the former, where prices will continue their bullish trend. If there is an inverted hammerstick or an evening star, prices are turning to a different direction.
It is important to note that these patterns are signals, and not a guarantor of the market trend. To get a better grasp on the direction of the market, you look for levels of resistance and support on the prices.
- Resistance Level: A price level in the chart that is impeding bullish movement
- Support Level: A price level stopping any drop or bearish movement.
To use candlestick patterns to find the resistance and support level, line up the highs and lows of the recent chart. Using the example above, you can see four price points from the top and bottom where the candle’s body is not touching.
Traders are less likely to go past this level unless markets dictate otherwise. If the market passes resistance levels, there will be a significant market reaction that often results in an upward trend.
You can see at the very end where bullish candles form pass the resistance level. Look for the candlesticks pattern you learned. You can see an inverted candle form in between two bearish candles and a bullish engulfing stick forming afterwards to confirm the upward trend. Traders will take a long position near the price level of the inverted hammer to take advantage of the bearish movement.
Limitations of Using Candlesticks
Using candlestick patterns makes it easy for you to see market trends and identify potential shifts. With that in mind, there are limitations when it comes to reading the candlesticks:
- Can be Misinterpreted: All patterns are not guaranteed indicators of the marketing continuing its trend or of shifting to a different direction.
- Does Not Reflect Current Market: Price movements shown on the previous candlestick chart do not show what is currently happening to the market. There is a chance that price movement contradicts the previous reading due to external factors affecting the asset’s value.
- Subject to Market Volatility: When the market becomes volatile due to market participation or trading sessions, false patterns are likely to form in candlestick charts.
You can surpass the limitations of candlestick reading by combining other methods of reading the market. This includes identifying order blocks and the fair value gap. It also helps look up breaking news that can affect the market.
Final Word: Understanding Candlestick Patterns
Having a clear grasp of the candlestick patterns can help you break into the day trading market. Apart from recognizing common patterns, you need a full context of the market trend to gain from your interpretation of the candlesticks. In addition, using other market analysis methods and being familiar with the asset you are trading helps you find profitable entry points for your trades. To get the basic skills you need for day trading, including candlestick pattern reading, join our MMT beginner group today!
FAQ: Candlestick Patterns for Beginners
Why Candlestick Patterns and Not Line Chart?
Line charts offer limited information to day traders, as which does not show where the price opened or closed. These charts only show where the price was closed at each point. Traders still use line charts to check on historical price movement or day-to-day changes.
Are there apps to help identify candlestick patterns?
You can find apps like the Candlestick Scanner on mobile stores. It can spot patterns like the hammer, shooting star, Harami, and rising three methods using the app’s algorithm.
Can a color-blind trader still read candlestick patterns?
Most brokerage or trading platforms have accessibility options for color blind traders. Trading View is one example that has a color blind option as part of its Color Scheme option. These accessibility options allow anyone to see market trends with the candlestick movement.